

Before you start
- Having an addressing plan and a flow matrix, for example those in understanding firewalls
In plain words
A network diagram is the building plan for the IT department. When everything's fine, nobody looks at it; on the day of a failure, an audit or a new colleague's arrival, it's the first thing you open. draw.io is a free drawing application that runs in the browser or installed on the computer, with thousands of device icons. Used well, it produces a diagram that is up to date, readable and reusable, rather than a frozen image nobody dares to change.
1. Three views, not just one
A single diagram that shows everything quickly becomes unreadable. Separate three views, on different layers or pages of the same file:
| View | What it shows | Useful for |
|---|---|---|
| Physical | Devices, cables, ports, position in the rack | Working on site, replacing a device |
| Logical | Networks, VLANs, addresses, security zones, gateways | Understanding the addressing, configuring a new device |
| Flows | Who talks to whom, on which ports, what is published on the internet | Writing and checking firewall rules, passing an audit |
This tutorial draws these three views for the reference plan used in understanding firewalls, the OPNsense tutorial and the UniFi tutorial.
2. draw.io at a glance
| Item | Detail |
|---|---|
| Price and licence | Free, open source code |
| Web version | app.diagrams.net, no account needed. The file is saved where you choose: on your computer, or in an online storage you connect. |
| Desktop app | Windows (installer, MSI, portable version), macOS, Linux (.deb, .rpm, AppImage). Version 32.3 in October 2026. Works completely offline. |
| Integrations | Extension for VS Code, Confluence and Jira, Nextcloud, and an editor built into BookStack |
| Format | .drawio (XML), or SVG and PNG that keep an editable copy of the diagram |
For professional use, prefer the desktop app: architecture diagrams contain addresses, server names and filtering rules, sensitive information best kept on your own disks.
Quick installation:
# Windows (winget)
winget install JGraph.Draw

# Debian, Ubuntu: download the .deb from the releases page, then
sudo apt install ./drawio-amd64-*.deb
The alternatives: Microsoft Visio (paid, standard in businesses, which draw.io can import as .vsdx), Lucidchart (online, paid), Excalidraw (sketch style, open source), yEd (automatic layout). draw.io offers the best compromise for infrastructure documentation.
3. Getting to know the interface
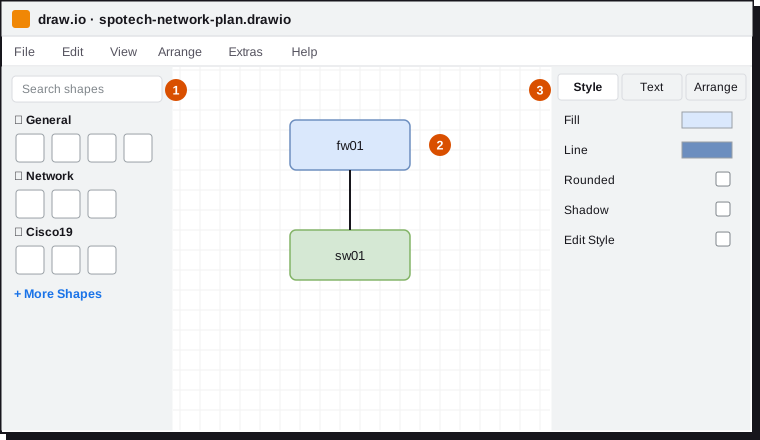
Time-saving moves:
| Action | How |
|---|---|
| Add a shape | Click in the library, or double-click an empty area then search |
| Connect two shapes | Hover over a shape, drag one of the blue arrows to the other shape |
| Duplicate | Ctrl+D, or Ctrl + drag |
| Group / ungroup | Ctrl+G / Ctrl+Shift+U |
| Copy then paste a style | Edit › Copy Style, then Edit › Paste Style |
| Edit the style as text | Ctrl+E (Edit Style) |
| A shape's data | Ctrl+M (Edit Data) |
| Layers | Ctrl+Shift+L |
| Align, distribute | Multiple selection, then the Arrange tab |
Turn on the grid (View › Grid) and leave snapping on: shapes aligned to the grid immediately give a cleaner diagram.
4. Choosing your icons
Click + More Shapes at the bottom of the library, then tick only what you need.
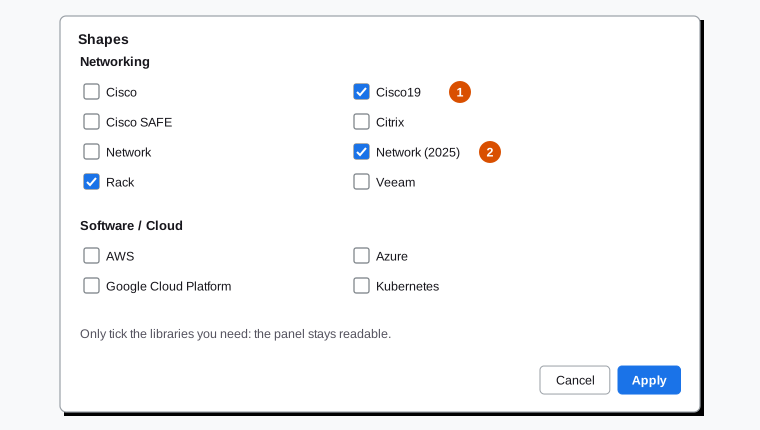
| Library | Use |
|---|---|
| Cisco19 | Standard network icons (firewall, router, switch, server, access point). Recognised by every administrator, even outside Cisco hardware. |
| Network (2025) | The second "Network" in the list: modern icons, customisable colours, long shadow that can be turned off |
| Rack | Racks and devices to scale, for the physical view |
| AWS, Azure, Google Cloud | For cloud resources. See the cloud comparison. |
One family of icons per diagram. Mixing Cisco19, 3D icons and brand logos makes a confusing diagram. To reuse your usual devices (with their data), create your own library: File › New Library, then drag your configured shapes into it.
5. Drawing the plan, step by step
Step 1: prepare the page
- File › Page Setup: A3 landscape format, for a diagram you'll print or display.
- At the top left, a title and a title block: version, author (for example
spo), date of the last update. A diagram with no date is a diagram you can't tell is still true.
Step 2: create the layers
View › Layers (Ctrl+Shift+L), then + to add a layer. Create four, in this order from bottom to top:
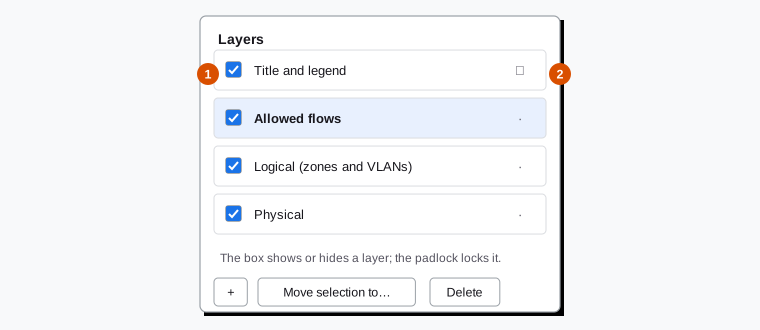
The selected layer receives new shapes. To move a shape to another layer: select it, then Move selection to…
Step 3: the main chain (Physical layer)
From top to bottom: Internet (cloud shape), ISP router, firewall, switch. Connect them with lines without arrows: a cable has no direction. The firewall–switch link, which carries all the VLANs, is drawn thicker (width 4) with the label trunk.
Step 4: the zones (Logical layer)
Each network becomes a container: a rounded rectangle to which you add container=1 in Edit Style (Ctrl+E), or a shape with a title bar such as Swimlane in the Advanced library. Its title carries the name, the VLAN and the network, for example OFFICES · VLAN 20 and 10.10.20.0/24.
Then drag the devices into their container: they follow the container when you move it, and the diagram stays tidy.
Step 5: attach data to devices
Select a device, then Ctrl+M (Edit Data). Add properties: name, ip, model, role, location.
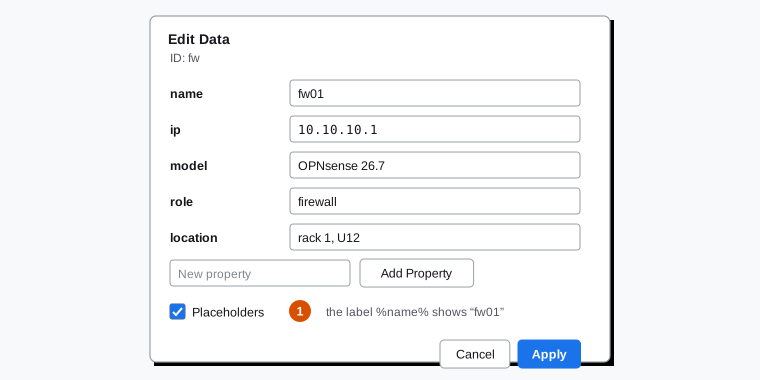
Tick Placeholders, then write the shape's label like this: %name% on the first line and %ip% on the second. The label then shows fw01 and 10.10.10.1. The benefit: the information is entered only once, it appears in the tooltip on hover, and an address change is made in a single place.
Step 6: the flows (Allowed flows layer)
On this layer, draw the important flows from the matrix: coloured dotted arrows, with a short label (443 published, AD, SMB, admin). Don't draw every flow: only those that help understanding. The detail stays in the flow matrix, in your knowledge base.
Hiding this layer gives a "clean" logical diagram; showing it on top of the logical view gives the security view.
Step 7: the legend
On the Title and legend layer: the meaning of each line (cable, trunk, internal flow, published flow, administration), each zone colour, and a sentence reminding that any flow not shown is blocked.
Step 8: check
- Hide each layer in turn: each view must remain understandable on its own.
- Compare with the real configuration: a wrong diagram is worse than no diagram.
The template to download
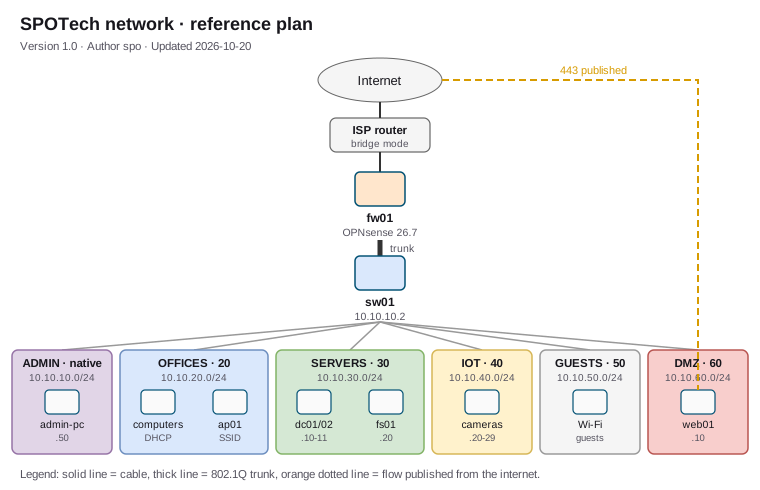
The file spotech-network-plan.drawio contains this plan with its four layers, its zones as containers and devices whose labels use the %name% and %ip% properties. Open it with File › Open in the desktop app (or File › Open from › Device in the web version), then adapt it to your network.
6. Conventions for all your diagrams
Write these conventions down once, in your knowledge base, and apply them to every diagram:
| Element | Suggested convention |
|---|---|
| Zone colour | A fixed colour per zone, everywhere: ADMIN purple, OFFICES blue, SERVERS green, IOT yellow, GUESTS grey, DMZ red |
| Cable | Solid line, no arrow |
| 802.1Q trunk | Thick solid line, trunk label and list of VLANs if useful |
| Wi-Fi | Thin dotted line, no arrow |
| VPN | Double line or long dashes, label with the VPN type |
| Allowed flow | Dotted arrow, in the source zone's colour, labelled with the service or port |
| Naming | The device's short DNS name (fw01, sw01, dc01), never "the server at the back" |
| Title block | Title, version, author, date, and a link to the detailed documentation |
| Pages | One page per view or per site: Physical, Logical, Flows, Rack 1, Secondary site |
7. Export, share, version
Keep the diagram editable
File › Export as › SVG (or PNG):
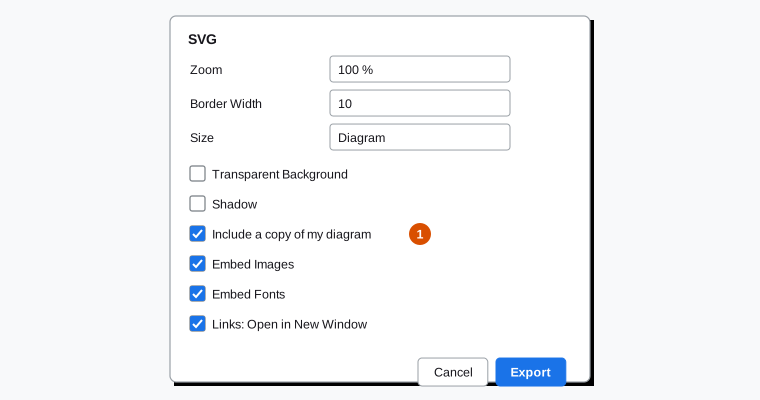
With Include a copy of my diagram, the SVG or PNG file is both an image you can insert anywhere (wiki, documentation, email) and a diagram you can reopen in draw.io (File › Open, or drag and drop onto the drawing area). Name it network-plan.drawio.svg to show that it's editable.
| Format | Use |
|---|---|
.drawio |
Working file |
.drawio.svg |
Editable vector image: wiki, Git repository, web documentation |
.drawio.png |
Editable image for tools that don't accept SVG |
| Printing, sending to a supplier, audit appendix |
Version with Git
A .drawio or a .drawio.svg is text (XML): it goes into a Git repository alongside scripts and configuration, with the history of changes. The Draw.io Integration extension for VS Code opens and edits these files directly in the editor, and GitHub, GitLab or Forgejo display them as images in Markdown files.
git add docs/network-plan.drawio.svg
git commit -m "Network: add VLAN 60 (DMZ) and the web01 server"
In a wiki
BookStack has the draw.io editor built in: the diagram is edited directly in the page. Confluence has an official draw.io app. Elsewhere, insert the .drawio.svg and keep the link to the source file.
8. Going further
- Generate a diagram from data: Arrange › Insert › Advanced › CSV creates shapes and links from a table (an inventory export, for example from GLPI). Arrange › Insert › Advanced › Mermaid converts a diagram written as text.
- Clickable links: a device can point to its page in the wiki or its admin interface (Edit › Edit Link). In the SVG export, links stay active.
- See the XML: Extras › Edit Diagram shows the diagram's code, useful for bulk changes.
- Layers for projects: a "2027 changes" layer with the planned devices, shown in meetings and hidden day to day.
9. Checklist
| Item | Done? |
|---|---|
| draw.io desktop installed, files kept in a backed-up folder or a Git repository | ☐ |
| A single family of icons per diagram | ☐ |
| Separate Physical, Logical, Flows and Legend layers | ☐ |
| Zones drawn as containers, in the convention's colours | ☐ |
Devices with data (name, IP, model) and %name% / %ip% labels |
☐ |
| Cables without arrows, thick trunk, flows as dotted arrows | ☐ |
| Title block with version, author and date | ☐ |
.drawio.svg export with a copy of the diagram for the wiki |
☐ |
| Diagram compared with the real configuration after every change | ☐ |